 Lýsigagnagátt
Iceland
Type of resources
Available actions
Topics
INSPIRE themes
Keywords
Contact for the resource
Provided by
Years
Formats
Representation types
Update frequencies
status
Service types
Scale
-

Riparian zones represent transitional areas occurring between land and freshwater ecosystems, characterised by distinctive hydrology, soil and biotic conditions and strongly influenced by the stream water. They provide a wide range of riparian functions (e.g. chemical filtration, flood control, bank stabilization, aquatic life and riparian wildlife support, etc.) and ecosystem services. The Riparian Zones products support the objectives of several European legal acts and policy initiatives, such as the EU Biodiversity Strategy to 2020, the Habitats and Birds Directives and the Water Framework Directive. Green Linear Elements (GLE) are ecologically significant, structural landscape elements which act as important dispersion vectors of biodiversity. GLEs comprise hedgerows and lines of trees and offer a wide range of ecosystem services: they are linked to both landscape richness and fragmentation of habitats, with a direct potential for restoration, and contribute also to hazard protection. Green linear elements form part of the Green Infrastructure and are specifically addressed in the EU Biodiversity Strategy 2020. The GLE product provides reliable and detailed geospatial information on the occurrence and spatial distribution of: Small linear vegetation features such as hedgerows, scrub and tree rows with a minimum length of 100m and a width of up to 10m; Isolated patches of trees and scrub with a size between 500 m² and 0.5 ha. Green linear elements including trees and hedgerows with 100m minimum length and 500 m² Minimum Mapping Unit (MMU)
-

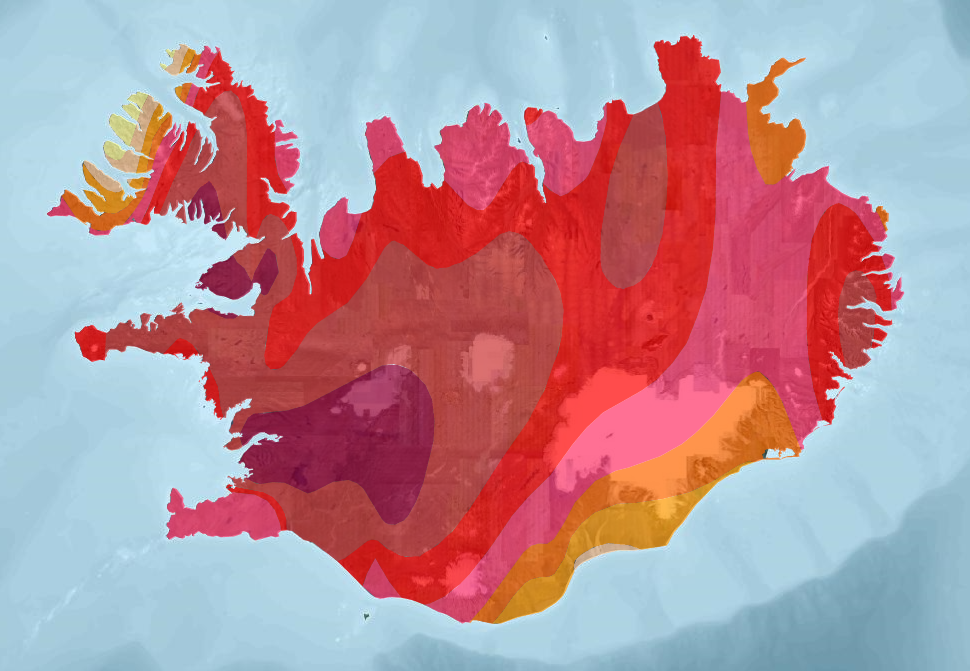
EN This shadow map illustrates terrain-induced shadows at 17:45 on August 12th, 2026. The solar eclipse will not be visible within the shaded areas. Shadow coverage may vary depending on the simulation resolution and the specific time. IS Skuggakortið sýnir staði þar sem skuggar falla klukkan 17:45 þann 12. ágúst 2026. Sólmyrkvinn mun ekki sjást á þeim svæðum sem eru í skugga. Skuggasvæðin geta verið breytileg vegna upplausnar hæðarkortsins og á öðrum tímum.
-

Riparian zones represent transitional areas occurring between land and freshwater ecosystems, characterised by distinctive hydrology, soil and biotic conditions and strongly influenced by the stream water. They provide a wide range of riparian functions (e.g. chemical filtration, flood control, bank stabilization, aquatic life and riparian wildlife support, etc.) and ecosystem services. The Riparian Zones products will support the objectives of several European legal acts and policy initiatives, such as the EU Biodiversity Strategy to 2020, the Habitats and Birds Directives and the Water Framework Directive. Land Cover/Land Use (LC/LU) classification is tailored to the needs of biodiversity monitoring in a tailored buffer zone along large and medium-sized European rivers (with Strahler levels 3-8 derived from EU-Hydro). LC/LU is extracted from VHR satellite data and other available data in a buffer zone of selected rivers. The classes follow the pre-defined nomenclature on the basis of MAES typology of ecosystems (Level 1 to Level 4) and Corine Land Cover, providing 80 distinct thematic classes with a Minimum Mapping Unit (MMU) of 0.5 ha and a Minimum Mapping Width (MMW) of 10 m. The production of the Riparian Zones products was coordinated by the European Environment Agency in the frame of the EU Copernicus programme.
-

[IS]: Drónamyndir af svæðum þar sem fram fer vöktun á náttúru Íslands. Aflað af Náttúrufræðistofnun. Fyrir frekari upplýsingar um gögnin er hægt að hafa samband við Náttúrufræðistofnun. Upplýsingar um drónamyndirnar er að finna í footprint lagi. Þar má meðal annars sjá hvenær myndirnar eru teknar og hægt að finna niðurhalslink fyrir þær. WMS þjónusta: https://gis.lmi.is/mapcache/web-mercator/wms Nafn á gagnasettum: drones_orthographics, drones_orthographics_2020. drones_orthographics_2021, drones_orthographics_2022, drones_orthographics_2023, drones_orthographics_2024, drones_orthographics_2025 [EN] Drone imagery of areas where monitoring of Iceland’s natural environment is conducted. Collected by Natural Science Institute of Iceland. For more information, please contact Natural Science Institute of Iceland. Information about the drone imagery can be found in a footprint layer. It includes the capture dates of the images and provides download links among other things. WMS service: https://gis.lmi.is/mapcache/web-mercator/wms Nafn á gagnasettum: drones_orthographics, drones_orthographics_2020, drones_orthographics_2021, drones_orthographics_2022, drones_orthographics_2023, drones_orthographics_2024, drones_orthographics_2025
-
The dataset presents three layers of geothermal data from Iceland based on "Atlas of Geothermal Resources in Europe" (2002). Heat-flow density, Temperature at 1000 meters and Temperature at 2000 meters (1:10 000 000).
-

[IS] WMS þjónusta fyrir drónamyndir frá Landmælingum Íslands. [EN] WMS service to serve drone imagery from the national land survey of Iceland.
-

Corine Land Cover (CLC) 2012 and CLC change 2006-2012 are two of the datasets produced within the frame of the Initial Operations of the Copernicus programme (the European Earth monitoring programme previously known as GMES) on land monitoring. Corine Land Cover (CLC) provides consistent information on land cover and land cover changes across Europe. This inventory was initiated in 1985 (reference year 1990) and established a time series of land cover information with updates in 2000, 2006 and 2012 being the last one. CLC products are based on photointerpretation of satellite images by national teams of participating countries - the EEA member and cooperating countries – following a standard methodology and nomenclature with the following base parameters: 44 classes in the hierarchical three level Corine nomenclature; minimum mapping unit (MMU) for status layers is 25 hectares; minimum width of linear elements is 100 metres; minimum mapping unit (MMU) for Land Cover Changes (LCC) for the change layers is 5 hectares. The resulting national land cover inventories are further integrated into a seamless land cover map of Europe.Land cover and land use (LCLU) information is important not only for land change research, but also more broadly for the monitoring of environmental change, policy support, the creation of environmental indicators and reporting. CLC datasets provide important datasets supporting the implementation of key priority areas of the Environment Action Programmes of the European Union as protecting ecosystems, halting the loss of biological diversity, tracking the impacts of climate change, assessing developments in agriculture and implementing the EU Water Framework Directive, among others.More about the Corine Land Cover (CLC) and Copernicus land monitoring data in general can be found at http://land.copernicus.eu/.
-

The combined Water and Wetness product is a thematic product showing the occurrence of water and wet surfaces over the period from 2009 to 2015. Two products are available: o The main Water and Wetness (WAW) product with defined classes of (1) permanent water, (2) temporary water, (3) permanent wetness and (4) temporary wetness. o The additional expert product: Water & Wetness Probability Index (WWPI) The products show the occurrence of water and indicate the degree of wetness in a physical sense, assessed independently of the actual vegetation cover and are thus not limited to a specific land cover class and their relative frequencies. A verification of the Water and Wetness layer was performed by the Institute of Nature Research during autumn of 2018 and the data and resulting report are made available on the NLSI websites.
-

The European Urban Atlas provides reliable, inter-comparable, high-resolution land use and land cover data for 800 Functional Urban Area (FUA) for the 2012 reference year in EEA39 countries. The spatial data can be downloaded together with a map for each FUA covered and a report with the metadata for the respective area. Additional information (product description, mapping guidance and class description) can be found here: https://land.copernicus.eu/user-corner/technical-library/urban-atlas-2012-mapping-guide-new Commission Directorate-General for Regional and Urban Policy and the Directorate-General for Enterprise and Industry in the frame of the EU Copernicus programme, with the support of the European Space Agency and the European Environment Agency.
-

Röð uppréttra loftmynda úr loftmyndasafni Náttúrufræðistofnunar sem unnar voru á árunum 2013 til 2018 hjá Jarðvísindastofnun HÍ, sem partur af tveimur verkefnum: 1 - Mælingar á jöklabreytingum úr sögulegum loftmyndum. Þetta verkefni var unnið af Joaquín M.C. Belart í M.Sc. og Ph.D. hjá Jarðvísindastofnun. Útvaldar loftmyndir frá 1945 til 1994 voru skannaðar hjá Landmælingum Íslands sérstaklega fyrir þetta verkefni. Vinnsla þessara loftmynda fór fram með því að nota "Ground Control Points" (GCP) sem teknir voru úr lidarmælingum á íslenskum jöklum. Úrvinnsla gagna úr Drangajökli fór fram með ERDAS hugbúnaðinum. Nánari upplýsingar um vinnsluna er að finna í Magnússon o.fl., 2016 (https://tc.copernicus.org/articles/10/159/2016/tc-10-159-2016.html). Úrvinnsla gagna frá öðrum jöklum var unnin með MicMac hugbúnaðinum, einnig með GCP teknir af lidar. Nánari upplýsingar um vinnsluna eru fáanlegar í Belart o.fl., 2019 (https://www.cambridge.org/core/journals/journal-of-glaciology/article/geodetic-mass-balance-of-eyjafjallajokull-ice-cap -for-19452014-processing-guidelines-and-relation-to-climate/9B715A9E0413A6345C2B151B1173E71D) og Belart o.fl., 2020 (https://www.frontiersin.org/articles/10.31630/feart/full.316390/feart. 2 - Mælingar á hraunmagni Heklugosanna á 20. öld. Þetta verkefni var unnið af Gro B.M. Pedersen sem hluti af verkefni þar sem unnið var að umhverfiskortlagningu og vöktun Íslands með fjarkönnun "Environmental Mapping and Monitoring of Iceland by Remote Sensing" (EMMIRS, fjármagnað af Rannís) á árunum 2015-2018. Loftmyndirnar af Heklu frá 1945 til 1992 voru skannaðar af Landmælingum Íslands. Vinnsla þessara mynda var gerð með ERDAS hugbúnaðinum og nánari upplýsingar um vinnsluna er hægt að nálgast í Pedersen o.fl., 2018 (https://agupubs.onlinelibrary.wiley.com/doi/full/10.1002/2017GL076887) --------------------------------------------------------------------------------------------------------------- A series of orthomosaics using the archives of aerial photographs from Náttúrufræðistofnun (Loftmyndasafn) created between 2013 and 2018 at the Institute of Earth Sciences, as part of two projects: 1 - Measurements of glacier changes from historical aerial photographs. This project was conducted by Joaquín M.C. Belart during his M.Sc. and his Ph.D. at the Institute of Earth Sciences. A selection of aerial photographs from 1945 to 1994 were scanned at Náttúrufræðistofnun specifically for this project. The processing of these aerial photographs was done using Ground Control Points (GCPs) extracted from lidar surveys of Icelandic glaciers. The processing of the data from Drangajökull ice cap was done using the ERDAS software. Further details on the processing are available in Magnússon et al., 2016 (https://tc.copernicus.org/articles/10/159/2016/tc-10-159-2016.html). The processing of the data from other glaciers was done using the MicMac software, also with GCPs extracted from lidar. Further details of the processing are available in Belart et al., 2019 (https://www.cambridge.org/core/journals/journal-of-glaciology/article/geodetic-mass-balance-of-eyjafjallajokull-ice-cap-for-19452014-processing-guidelines-and-relation-to-climate/9B715A9E0413A6345C2B151B1173E71D) and Belart et al., 2020 (https://www.frontiersin.org/articles/10.3389/feart.2020.00163/full) 2 - Measurements of the lava volumes of the Hekla eruptions in the 20th century. This project was conducted by Gro B.M. Pedersen as part of the Environmental Mapping and Monitoring of Iceland by Remote Sensing (EMMIRS, financed by Rannís) project between 2015-2018. The aerial photographs of Hekla from 1945 to 1992 were scanned by Náttúrufræðistofnun. The processing of these photographs was done using the ERDAS software, and further details of the processing are available in Pedersen et al., 2018 (https://agupubs.onlinelibrary.wiley.com/doi/full/10.1002/2017GL076887) References: Belart J.M.C., Magnússon E., Berthier E., Pálsson, F., Aðalgeirsdóttir, G., & Jóhannesson, T. (2019). The geodetic mass balance of Eyjafjallajökull ice cap for 1945–2014: Processing guidelines and relation to climate. Journal of Glaciology, 65(251), 395-409. doi:10.1017/jog.2019.16 Belart J.M.C., Magnússon E., Berthier E., Gunnlaugsson Á.Þ., Pálsson F., Aðalgeirsdóttir G., Jóhannesson T, Thorsteinsson T and Björnsson H (2020) Mass Balance of 14 Icelandic Glaciers, 1945–2017: Spatial Variations and Links With Climate. Front. Earth Sci. 8:163. doi: 10.3389/feart.2020.00163 Magnússon, E., Belart, J.M.C., Pálsson, F., Ágústsson, H., and Crochet, P.: Geodetic mass balance record with rigorous uncertainty estimates deduced from aerial photographs and lidar data – Case study from Drangajökull ice cap, NW Iceland, The Cryosphere, 10, 159–177, https://doi.org/10.5194/tc-10-159-2016, 2016. Pedersen, G. B. M., Belart, J. M. C., Magnússon, E., Vilmundardóttir, O. K., Kizel, F., Sigurmundsson, F. S., et al. (2018). Hekla volcano, Iceland, in the 20th century: Lava volumes, production rates, and effusion rates. Geophysical Research Letters, 45, 1805–1813. https://doi.org/10.1002/2017GL076887