 Lýsigagnagátt
GeoTIFF
Type of resources
Available actions
Topics
INSPIRE themes
Keywords
Contact for the resource
Provided by
Years
Formats
Representation types
Update frequencies
status
Scale
Resolution
-
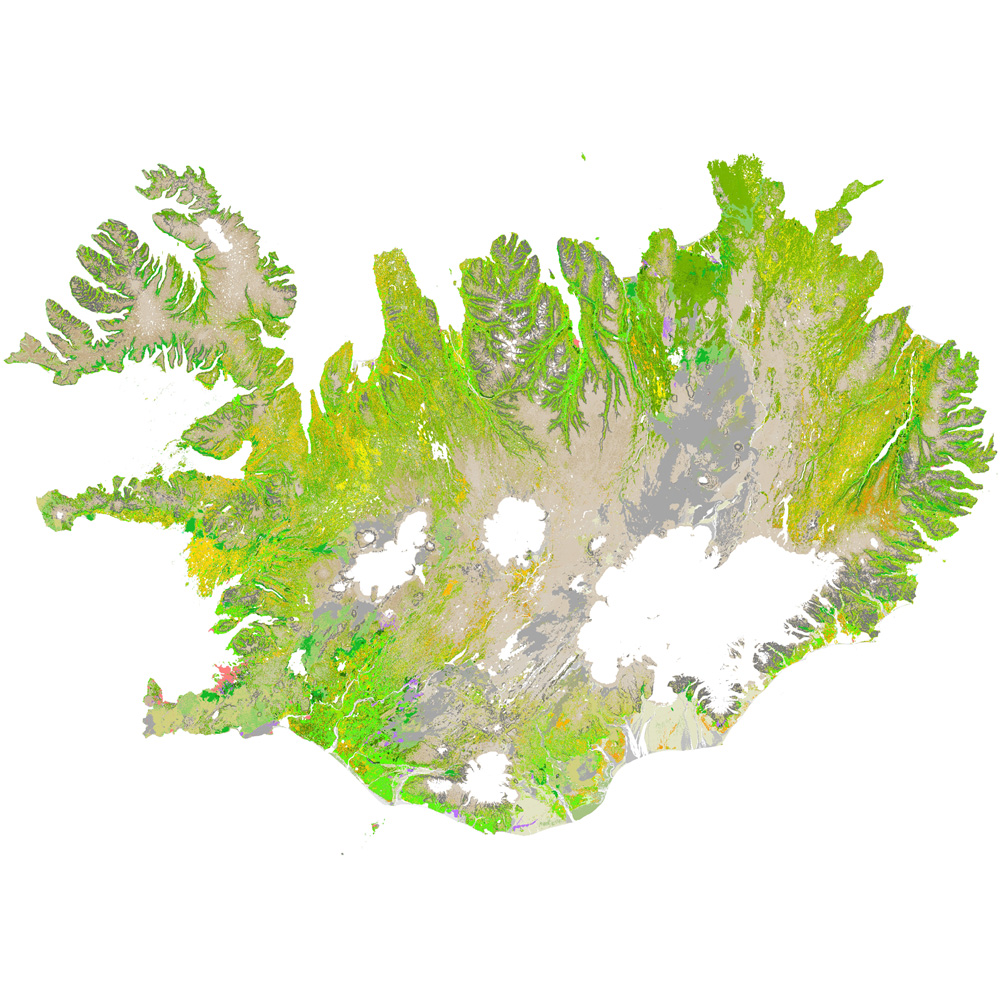
Gagnaset (data set) ni_vg25r_3utg: Vistgerðir á Íslandi: land (Habitat types of Iceland: terrestrial). Vistgerðakortið sýnir útbreiðslu landvistgerða á Íslandi. Alls hafa verið ákvarðaðar 64 vistgerðir á landi og skiptast í 12 meginflokka (vistlendi). Innan landvistgerða eru fjórar jarðhitavistgerðir sem finnast á háhita- og lághitasvæðum landsins. Landvistgerðum er skipt upp í tvö þrep. Við skilgreiningu og flokkun vistgerða á Íslandi var tekið mið af EUNIS-flokkunarkerfinu (European Environment Agency 2012) . Í 3. útgáfu vistgerðakortsins 2024 eru eingöngu landvistgerðir endurskoðaðar. Náttúrufræðistofnun Íslands leggur með ritinu Vistgerðir á Íslandi fram tillögur að flokkun vistgerða sem á sér fyrirmynd í samræmdri og viðurkenndri flokkun vistgerða í Evrópu. Flokkunin byggir á rannsóknum víða um land með fyrirvara um að bæta mætti í þá þekkingu. Athuga skal að aðgreining landvistgerða með fjarkönnun reyndist erfið, bæði fyrir lítið grónar vistgerðir sem og vel grónar, einkum innan vistlenda. Því má búast við verulegum skekkjum þótt þær séu mismiklar eftir vistgerðum. Nánari útlistun og mat á skekkjum má finna í aðferðalýsingu og á staðreyndasíðum vistgerða í ritinu „Vistgerðir á Íslandi“. Frekari upplýsingar um flokkun og skilgreiningu vistgerða má sjá í ritinu: Jón Gunnar Ottósson, Anna Sveinsdóttir og María Harðardóttir, ritstj. 2016. Vistgerðir á Íslandi. Fjölrit Náttúrufræðistofnunar nr. 54. 299 s. og á vef Náttúrufræðistofnunar.
-

The high resolution forest product consists of three types of (status) products and additional change products. The status products are available for the 2012 and 2015 reference years: 1. Tree cover density providing level of tree cover density in a range from 0-100% 2. Dominant leaf type providing information on the dominant leaf type: broadleaved or coniferous 3. A Forest type product. The forest type product allows to get as close as possible to the FAO forest definition. In its original (20m) resolution it consists of two products: 1) a dominant leaf type product that has a MMU of 0.5 ha, as well as a 30% tree cover density threshold applied, and 2) a support layer that maps, based on the dominant leaf type product, trees under agricultural use and in urban context (derived from CLC and high resolution imperviousness 2009 data). For the final 100m product trees under agricultural use and urban context from the support layer are removed. The high resolution forest change products comprise a simple tree cover density change product for 2012-2015 (% increase or decrease of real tree cover density changes). A verification of the Dominant Leaf Type layer was performed by the Institute of Nature Research during autumn of 2018 and the data and resulting report are made available on the NLSI websites.
-

Slope aspect map of Iceland. This tool calculates slope aspect (i.e. slope orientation in degrees clockwise from north) for each grid cell in an input digital elevation model (DEM). “Aspect values indicate the directions the physical slopes face.” The values of each cell in the output raster indicate the compass direction the surface faces at that location. It is measured clockwise in degrees from 0 (due north) to 360 (again due north), coming full circle. Flat areas having no downslope direction are given a value of -1.
-

Slope map of Iceland (in Degrees and Percent units). The slope gradient (slope, slope steepness) identifies the steepest downhill slope for a location in a surface: “the inclination of the land surface with respect to the horizontal plane” Basic local land-surface parameters. First partial derivative from surface.
-

The high resolution imperviousness products capture the percentage and change of soil sealing. Built-up areas are characterized by the substitution of the original (semi-) natural land cover or water surface with an artificial, often impervious cover. These artificial surfaces are usually maintained over long periods of time. A series of high resolution imperviousness datasets (for the 2006, 2009, 2012 and 2015 reference years) with all artificially sealed areas was produced using automatic derivation based on calibrated Normalized Difference Vegetation Index (NDVI). This series of imperviousness layers constitutes the main status layers. They are per-pixel estimates of impermeable cover of soil (soil sealing) and are mapped as the degree of imperviousness (0-100%). Imperviousness change layers were produced as a difference between the reference years (2006-2009, 2009-2012, 2012-2015 and additionally 2006-2012, to fully match the CORINE Land Cover production cycle) and are presented 1) as degree of imperviousness change (-100% -- +100%), in 20m and 100m pixel size, and 2) a classified (categorical) 20m change product. The production of the High Resolution Imperviousness products was coordinated by the European Environment Agency in the frame of the EU Copernicus programme. A verification of the Imperviousness layer was performed by the Institute of Nature Research during autumn of 2018 and the data and resulting report are made available on the NLSI websites.
-

The main high resolution grassland product is the Grassland layer, a grassland/non-grassland mask for the EEA39 area. This grassy and non-woody vegetation baseline product includes all kinds of grasslands: managed grassland, semi-natural grassland and natural grassy vegetation. It is a binary status layer mapping grassland and all non-grassland areas in 20m and (aggregated) 100m pixel size. Two additional (expert) products complete the high resolution grassland product: the Ploughing Indicator (PLOUGH) and the Grassland Vegetation Probability Index (GRAVPI). While the PLOUGH concentrates on historic land cover features with the aim to indicate ploughing activities in preceding years, the GRAVPI provides a measure of classification reliability. GRAVPI is a 20m pixel size product, mapping on a range of 1-100 the class probability. PLOUGH is a 20m pixel size additional product, mapping from 1-6 the number of years since the last indication of ploughing. A verification of the Grassland layer was performed by the Institute of Nature Research during autumn of 2018 and the data and resulting report are made available on the NLSI websites.
-

The combined Water and Wetness product is a thematic product showing the occurrence of water and wet surfaces over the period from 2009 to 2015. Two products are available: o The main Water and Wetness (WAW) product with defined classes of (1) permanent water, (2) temporary water, (3) permanent wetness and (4) temporary wetness. o The additional expert product: Water & Wetness Probability Index (WWPI) The products show the occurrence of water and indicate the degree of wetness in a physical sense, assessed independently of the actual vegetation cover and are thus not limited to a specific land cover class and their relative frequencies. A verification of the Water and Wetness layer was performed by the Institute of Nature Research during autumn of 2018 and the data and resulting report are made available on the NLSI websites.
-

The high resolution forest product consists of three types of (status) products and additional change products. The status products are available for the 2012 and 2015 reference years: 1. Tree cover density providing level of tree cover density in a range from 0-100% 2. Dominant leaf type providing information on the dominant leaf type: broadleaved or coniferous 3. A Forest type product. The forest type product allows to get as close as possible to the FAO forest definition. In its original (20m) resolution it consists of two products: 1) a dominant leaf type product that has a MMU of 0.5 ha, as well as a 30% tree cover density threshold applied, and 2) a support layer that maps, based on the dominant leaf type product, trees under agricultural use and in urban context (derived from CLC and high resolution imperviousness 2009 data). For the final 100m product trees under agricultural use and urban context from the support layer are removed. The high resolution forest change products comprise a simple tree cover density change product for 2012-2015 (% increase or decrease of real tree cover density changes). A verification of the Tree Cover Density layer was performed by the Institute of Nature Research during autumn of 2018 and the data and resulting report are made available on the NLSI websites.
-

IS: Myndkort af atburðum sem hafa átt sér stað á Reykjanesi frá árinu 2021 hafa orðið til í samstarfi Náttúrfræðistofnunar Íslands, Náttúrufræðistofnunar, Veðurstofu Íslands, Jarðvísindastofnunar og Almannavarnir, sem hluti af viðbragðsáætlunum, hættumati og rannsóknum. Í öllum atburðum voru teknar loftmyndir og hæðarlíkön útbúin ásamt myndkortum. Myndkortin eru aðgengileg í gegnum WMS þjónustu og á Umbrotasjá (https://kortasja.lmi.is/mapview/?application=umbrotasja). Gögnin eru uppfærð jafnt og þétt, eða þegar nýjar upplýsingar berast á meðan á gosinu stendur. Athugið að vísa í öll gögn sem eru notuð; „i“ táknið við hlið hvers gagnasafns í kortasjánni vísar í rétta tilvitnun fyrir hvert gagnasett. Um er að ræða nokkur gagnasett og því þarf að hafa í huga að vísa í öll gagnasett. EN: Orthomosaics of the events occurring on the Reykjanes peninsula, SW Iceland, beginning in 2021 have been created in a collaborative effort between the Institute of Nature Research (Náttúrufræðistofnun), the Icelandic Institute of Natural History (Náttúrufræðistofnun Íslands), the University of Iceland (Háskóli Íslands), and the Icelandic Meterological Office (Veðurstofa Íslands) as part of the response plans, hazard assessments and research. Upon each event, aerial photographs were collected and Digital Elevation Models (DEMs) and orthomosaics were produced of these events. The orthomosaics are available via WMS and in the Volcano Viewer webpage (https://kortasja.lmi.is/mapview/?application=umbrotasja). The data was created and distributed typically less than one day after data collection. The data is updated on weekly to monthly basis, or when new information is received during the eruption. All data used in publications should be cited correctly; the “i” symbol next to each dataset in the data viewer links to the correct citation for each dataset. Because this is an ongoing collaboration with multiple publications, be aware that the citation is different between datasets.
-

Samsett, innrauð heildarmynd af Íslandi, unnin úr 16 Landsat TM myndum eftir böndum 3,2, og 4. Myndeiningar eru 30 x 30. Upprétt miðað við 1:50.000 staðfræðikort og mælingar.